
Software
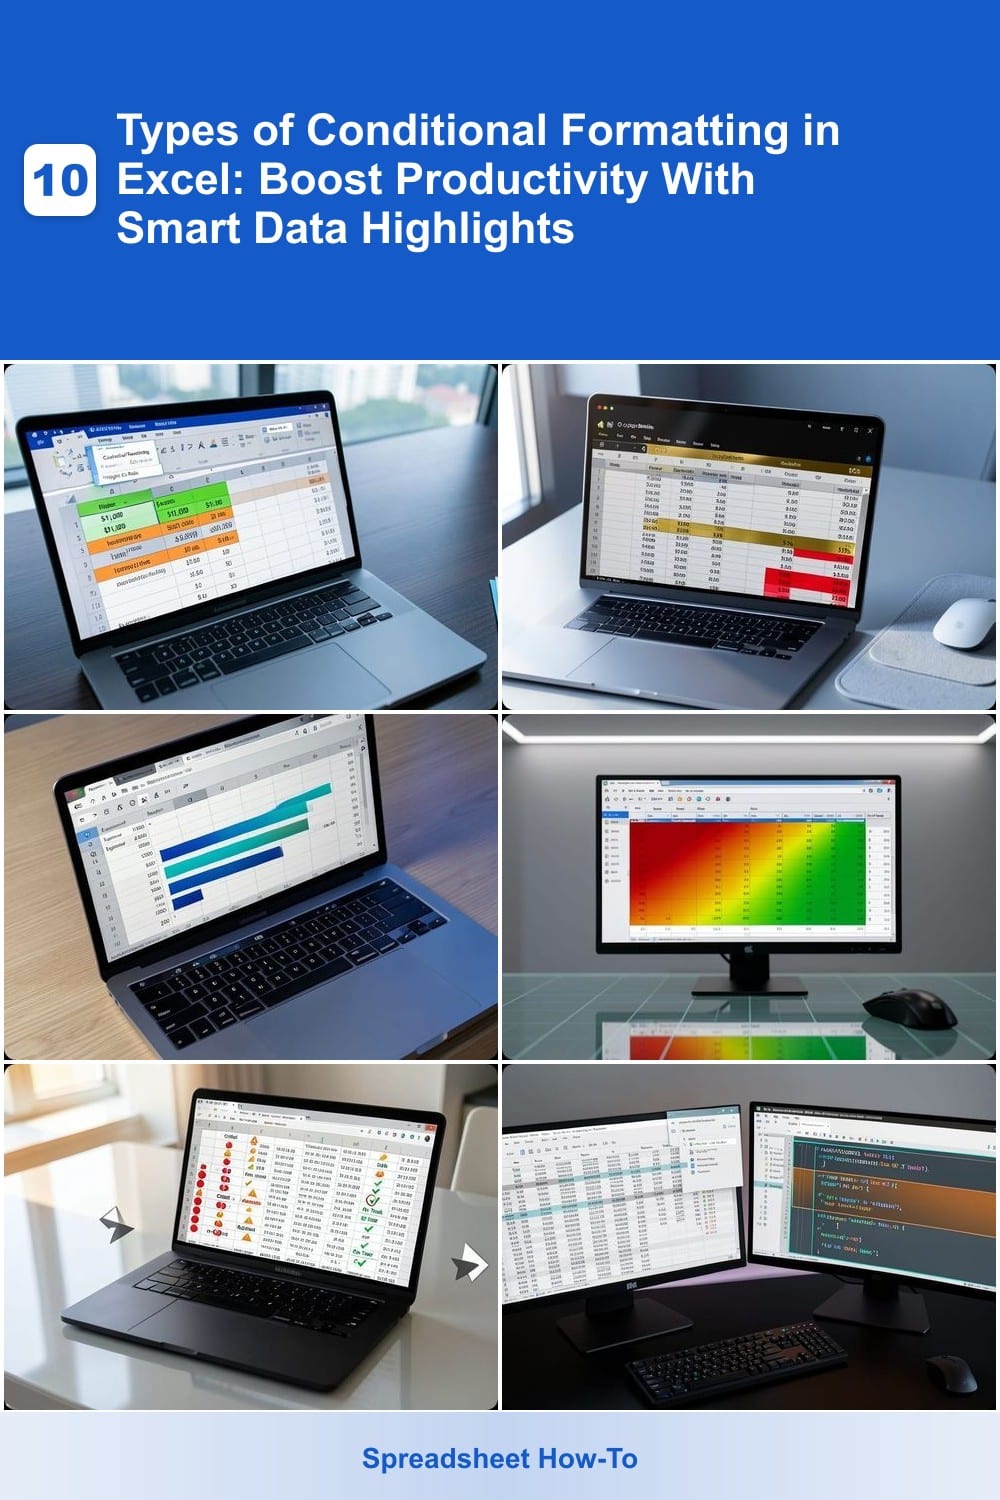
Conditional formatting in Excel transforms raw data into actionable insights with visual cues. These 10 dynamic formatting techniques help you spot trends, identify errors, and automate data analysis—saving hours of manual work.
Highlight Cells Rules for Basic Data Validation
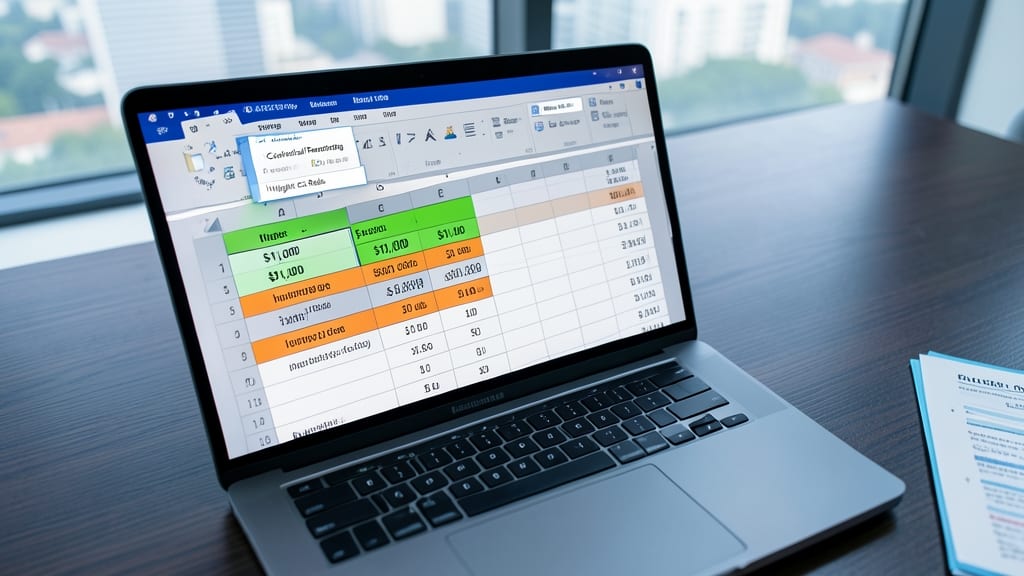
Struggling to spot errors or track key metrics in your spreadsheets? Highlight Cells Rules in Excel is your secret weapon—no coding required. This beginner-friendly tool lets you instantly flag cells that meet (or don’t meet) your criteria, like sales over $1,000 or inventory below 50 units.
With just a few clicks, you can set custom thresholds (e.g., "highlight red if value > 100") or text-based rules (e.g., "flag cells containing 'ERROR'"). It works across entire columns or specific ranges, and the rules update automatically when your data changes.
Perfect for new users, small-business owners, or anyone managing budgets, this rule is the fastest way to turn messy data into clear visual cues—no advanced formulas needed. ✨
Top/Bottom Rules to Identify Outliers
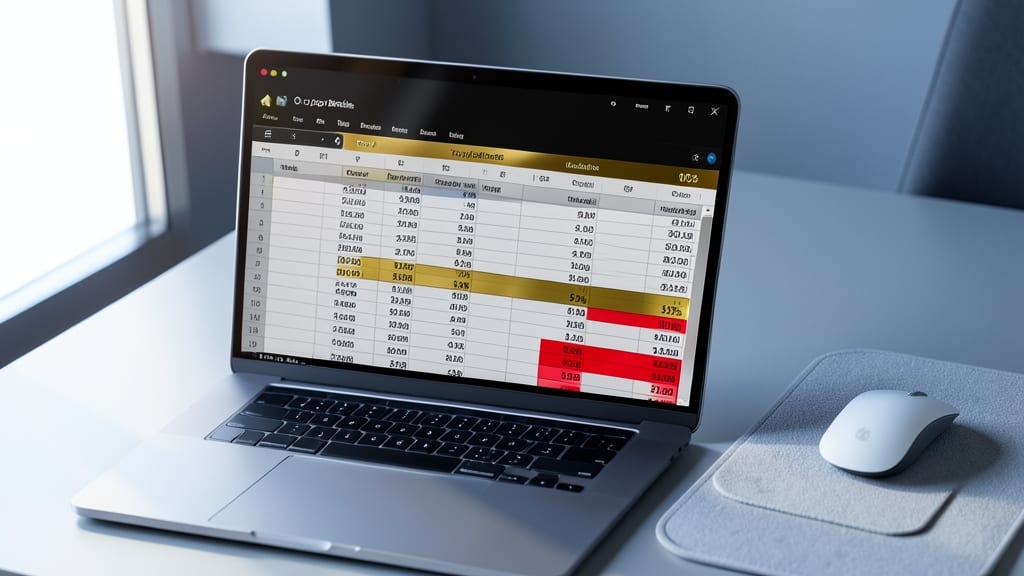
Tired of manually scanning spreadsheets to find your top performers or red flags? Top/Bottom Rules in Excel automatically highlights the best and worst values in your dataset—no formulas required. This feature lets you instantly see the top 10% of sales in gold or the bottom 5% of inventory in red, turning raw numbers into clear visual cues.
You can customize the percentage range (e.g., top 20% or bottom 15%) and even apply multiple rules to the same dataset. For example, flag the top 10% of revenue in green while marking the bottom 10% in red—ideal for quarterly reviews or performance audits. The formatting updates dynamically as your data changes, so you always stay current.
Sales managers and financial analysts will love this for quick trend analysis, while project leads can use it to spotlight high-risk items. No more guessing—just instant clarity with a few clicks. ✨
Data Bars for Visual Trend Comparison

Tired of scanning rows of numbers to spot trends? Data Bars turn your Excel data into mini-bar graphs that instantly show relative values—no extra charts needed.
With just a few clicks, you can visualize percentages, sales figures, or progress metrics as horizontal bars that scale automatically. Customize colors (e.g., blue-to-green gradients) to emphasize growth or decline, and adjust bar direction or length for clarity. Best of all, they adapt to your data range, so updates are zero-effort.
Perfect for project managers tracking team progress or marketers comparing campaign KPIs across regions—no clutter, just clear visual cues. ✨
Color Scales for Gradient-Based Analysis
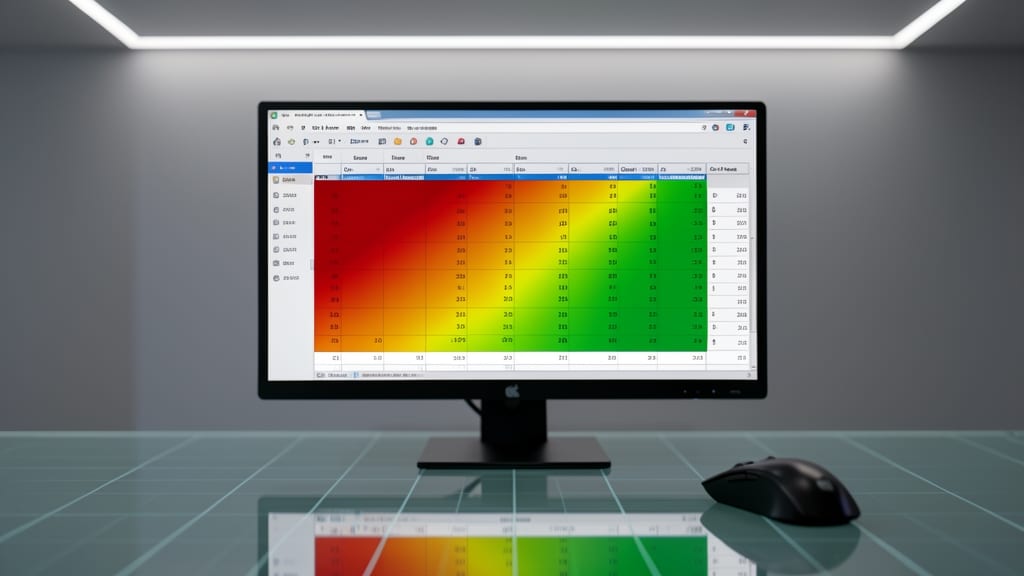
Turn raw numbers into intuitive heatmaps with Color Scales—Excel’s secret weapon for visualizing gradients like sales density, website traffic, or performance metrics across regions or categories.
This feature lets you map data ranges to a gradient color scale (e.g., red for low, green for high), instantly transforming spreadsheets into heatmap-style visualizations. Customize the color scheme (e.g., blue-to-yellow for temperature data) or use predefined options like traffic lights. Works seamlessly with PivotTables or static ranges, making it perfect for dashboards.
Ideal for marketers tracking campaign performance, HR analyzing employee engagement scores, or operations teams visualizing inventory levels. ⚡
Icon Sets for Qualitative Data Representation
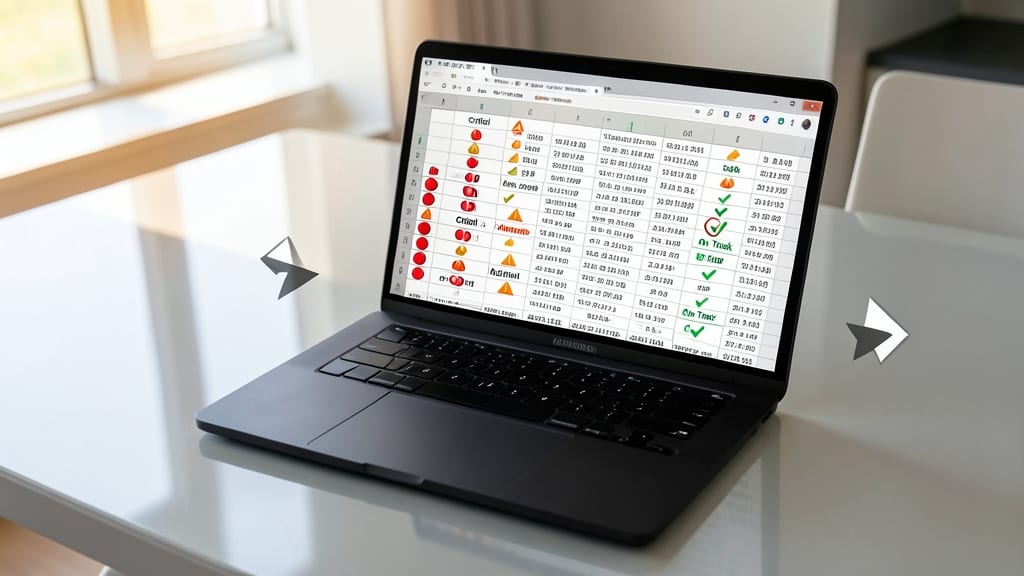
Tired of drowning in spreadsheets full of numbers? Icon Sets turn qualitative data into visual cues at a glance, replacing values with traffic lights (red/yellow/green) or directional arrows (left/right) for instant status updates.
With just a few clicks, you can format cells to show 'On Track' (green checkmark), 'At Risk' (yellow triangle), or 'Critical' (red X)—no formulas required. This is a game-changer for project managers tracking deadlines, HR teams monitoring hiring pipelines, or operations teams overseeing workflows. The built-in arrow icons (↑/↓) also work perfectly for trend analysis without cluttering your sheet.
Best for teams who prioritize clarity over complexity—ideal for dashboards where a single glance should reveal the big picture. ✨
Custom Formulas for Advanced Logic
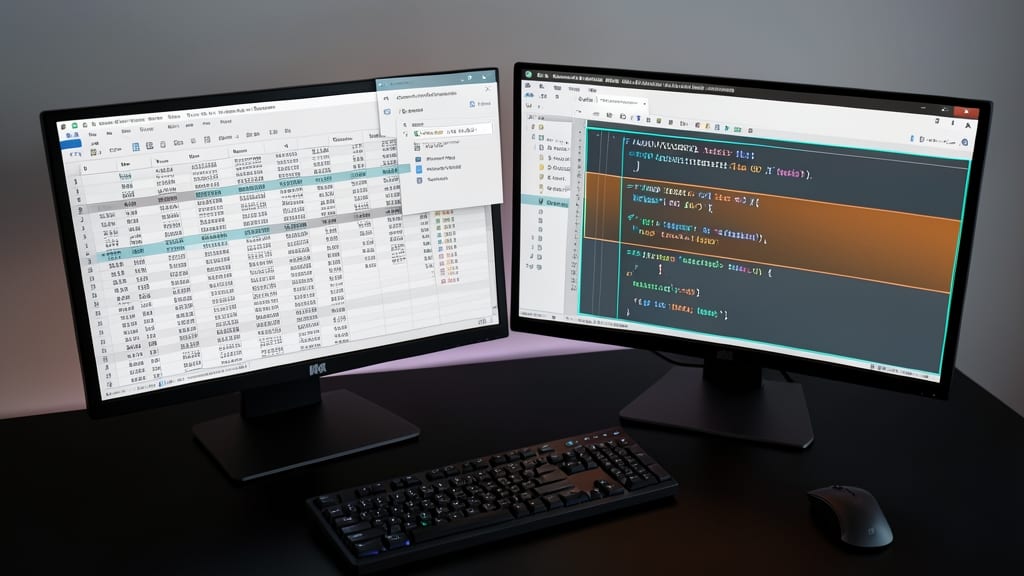
When your business rules defy simple "greater than" or "contains text" logic, Custom Formulas become your secret weapon. Unlike pre-built rules, this feature lets you build conditional formatting using full Excel formula syntax, including nested IF statements, AND/OR logic, and even VLOOKUP references—all to highlight cells based on your exact criteria.
For example, you could highlight cells in red where sales exceed $100K AND the region is 'West', or apply green formatting when inventory levels drop below reorder thresholds based on supplier lead times. The best part? You can reuse existing formulas from your workbook, ensuring consistency between your data validation and visual cues.
This is the go-to tool for financial analysts, supply chain managers, or anyone dealing with multi-condition scenarios. Once mastered, it turns Excel into a dynamic dashboard that adapts to your most complex workflows. ✨
Duplicate Value Highlighting
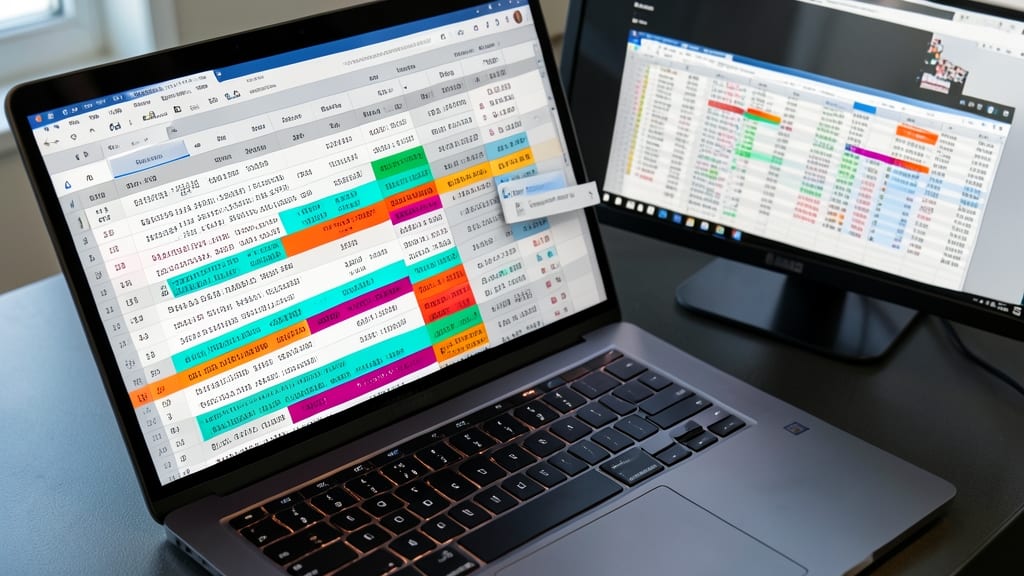
Tired of manually scanning spreadsheets for duplicate entries? Duplicate Value Highlighting automates the process, instantly flagging exact matches—whether you're auditing customer lists, tracking inventory, or cleaning up messy datasets.
With just a few clicks, you can apply custom colors to duplicate values while leaving unique entries untouched. Excel’s built-in rule lets you choose between highlighting entire rows or just the specific cells containing duplicates. For advanced users, combine this with data validation to enforce uniqueness or trigger alerts when duplicates appear. ⚡
Above Average/Below Average Rules
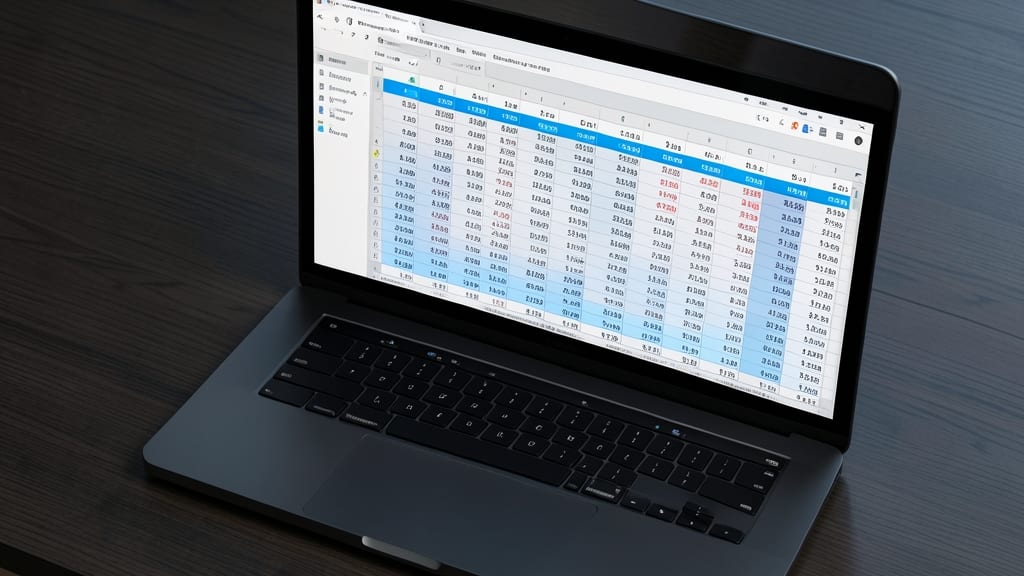
Tired of manually calculating averages and comparing each entry? The Above Average/Below Average Rules in Excel automatically highlights cells that exceed or fall short of your dataset’s mean—no formulas required.
With just a few clicks, you can set custom colors for values above average (e.g., blue for top performers) and below average (e.g., orange for underperformers). This rule works dynamically—update your data, and the formatting adjusts instantly. Perfect for sales reports, employee evaluations, or financial benchmarks where context matters as much as the numbers.
HR managers and team leads will love this for performance reviews, while analysts can use it to benchmark metrics against industry standards. No more guesswork—just clear, visual insights at a glance. ✨
Text That Changes Cell Colors
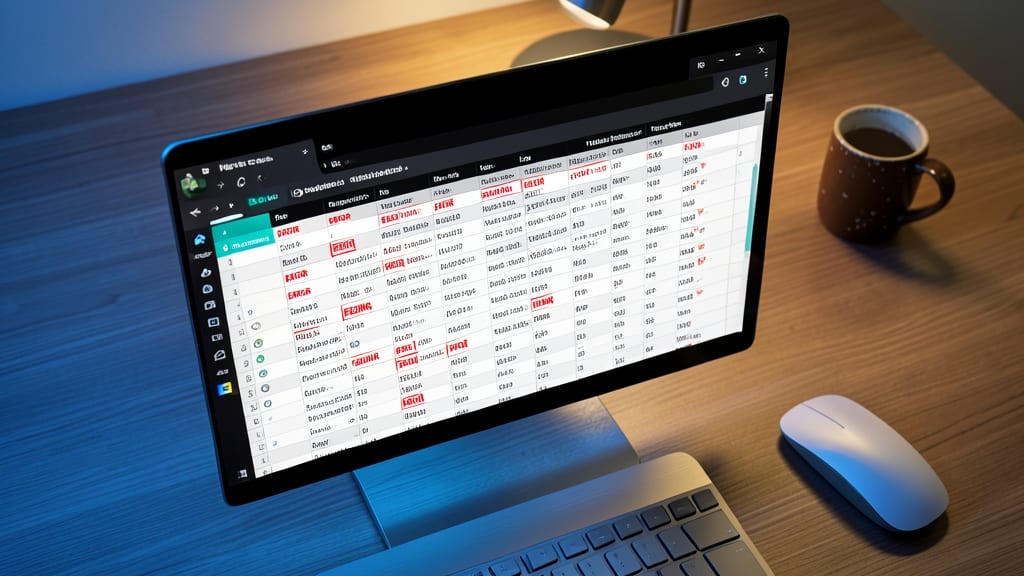
Tired of scanning endless rows of text for critical keywords like "ERROR" or "PENDING"? Text-based conditional formatting lets you instantly highlight cells containing specific words—no formulas required. Simply select your range, choose "Highlight Cells Rules," then pick "Text that contains" and enter your keywords.
Assign red to errors, green to approved items, and yellow to pending tasks for a visual workflow that cuts review time in half. This rule works across entire columns or specific ranges, and you can even stack multiple rules (e.g., "ERROR" in red + "URGENT" in bold). Best of all, it updates automatically when your data changes.
Perfect for support teams tracking ticket statuses, project managers monitoring deadlines, or QA analysts spotting defects—anyone who needs to spot text-based patterns at a glance. ✨
Sparkline Visualizations for Micro-Trends

Tired of staring at raw numbers when trends hide in plain sight? Sparkline visualizations turn single cells into interactive micro-charts—displaying line or bar graphs directly within your dataset. No pivot tables or separate dashboards required.
With just a few clicks, you can embed tiny line charts for stock prices, win/loss bars for daily sales, or temperature trends in weather data—all while keeping your worksheet clean. Excel supports three sparkline types (line, column, and win/loss) and lets you customize colors, markers, and axis scaling. Best of all, they update automatically when your data changes.
Perfect for analysts tracking real-time metrics (like website traffic or inventory levels) or managers reviewing weekly performance snapshots. No coding or add-ins needed—just pure Excel power. ✨