
Software
Mastering DAX functions in Power BI unlocks advanced data analysis capabilities that transform raw numbers into actionable insights. These 10 essential functions will elevate your reporting game from basic to expert-level, whether you're a beginner or seasoned analyst.
Calculated Columns for Data Transformation
If you've ever struggled to transform data in Excel using nested IF statements or helper columns, calculated columns in Power BI offer a cleaner, more scalable solution. This function lets you create new columns on-the-fly using DAX syntax, eliminating the need for manual data manipulation.
Unlike Excel, Power BI evaluates calculated columns once during data refresh—not repeatedly during calculations—which dramatically improves performance. You can derive metrics like customer segments ("Premium" if revenue > $10K), date-based flags (e.g., "HolidayWeek = IF(MONTH(Date) IN {12,1,2}, TRUE, FALSE)"), or even concatenated strings (e.g., "FullName = FirstName & " " & LastName). The syntax mirrors Excel’s familiarity but unlocks Power BI’s full potential.
This function is perfect for analysts transitioning from Excel who need to preserve transformations in their data model. It’s especially useful when you want to avoid cluttering your dataset with temporary columns or when you need deterministic results tied to specific rows. ✨
Summarize Data with SUMX Function

When your data model involves multiple related tables and you need precise control over aggregations, the SUMX function becomes your secret weapon. Unlike the basic SUM, which only adds up values in a single column, SUMX iterates through each row of a table and applies a custom calculation—perfect for conditional logic or cross-table operations.
This function shines when you need to multiply a quantity column by a price column (e.g., SUMX(Sales[Quantity], Sales[UnitPrice])) or apply dynamic filters within the aggregation. It handles row-by-row calculations seamlessly, making it ideal for scenarios like revenue projections, weighted averages, or custom metrics tied to relationships in your data model.
Analysts working with sales data, inventory systems, or financial models will find SUMX indispensable for creating accurate, flexible measures without bloating their data model. ⚡
Filter Context Control Using FILTER

When your Power BI visuals need to adapt on the fly—like showing only high-value transactions or excluding outliers—FILTER becomes your secret weapon. Unlike static slicers, this function lets you dynamically adjust what rows appear based on custom conditions, all within your measure or calculated column.
With FILTER(table, condition), you can create precise logic like "Show me sales where profit margin > 20% AND region = 'North'". It works seamlessly with CALCULATE for nested filtering, and its flexibility extends to filtering tables, columns, or even entire datasets. For example, you could build a dynamic KPI that recalculates based on user input without altering your data model.
This function is a game-changer for data analysts building interactive dashboards or business users needing real-time insights. Master it, and you’ll unlock visuals that respond intelligently to your audience’s needs. ✨
Time Intelligence with DATEADD
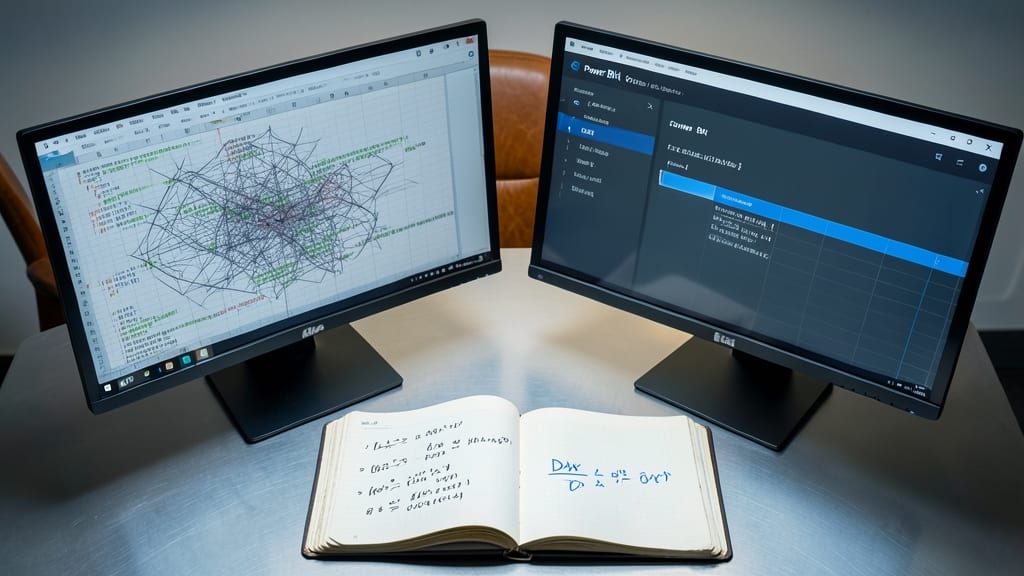
Tired of manually comparing financial quarters or sales months? DATEADD in DAX lets you shift dates by any interval—days, months, quarters, or years—with just a few clicks. This function is the secret weapon for year-over-year (YoY) comparisons and period-over-period (PoP) analysis, turning static data into dynamic insights.
With DATEADD, you can easily calculate metrics like "Last Year's Revenue" or "Same Quarter Growth" by adding or subtracting time periods from your existing dates. For example, DATEADD('Date'[Date], -1, YEAR) shifts your data back one year for direct comparison. It works seamlessly with time intelligence functions like SAMEPERIODLASTYEAR but offers more flexibility for custom calculations.
Financial analysts and sales teams will love this for automating trend analysis—no more manual data prep or Excel workarounds. Perfect for dashboards where historical comparisons drive decisions. ⚡
Relationship Navigation Using RELATED

Tired of creating convoluted calculated columns just to pull data from related tables in your star schema? The RELATED function in DAX is your secret weapon—it simplifies cross-table lookups with just one line of code.
This function retrieves a single value from a related table based on your data model's relationships, eliminating the need for complex joins or calculated columns. For example, you can pull a product category name from a separate table directly into a sales measure using RELATED(Product[Category]). It works seamlessly with one-to-many relationships and supports bidirectional filtering for dynamic results.
Data modelers and analysts working with star schemas (like sales, inventory, or financial models) will love this function—it keeps your DAX clean while unlocking powerful cross-table insights. ✨
Conditional Logic with IF Function

Every business rule you’ve ever written in Excel—now supercharged in Power BI. The IF function is the cornerstone of DAX logic, letting you create dynamic metrics that adapt to conditions like "show profit only if sales exceed $10K" or "flag underperforming regions."
With three arguments (logical test, value if true, value if false), it’s simple yet powerful enough to handle nested conditions with IFS or combine with AND/OR for complex scenarios. Need to highlight top performers? Use it to create conditional formatting that changes colors based on KPI thresholds. ⚡
Perfect for analysts who need to translate business requirements—like "alert when inventory falls below 50 units"—into visual, interactive reports without hardcoding exceptions. The true foundation of DAX flexibility! 💡
Advanced Filtering Using CALCULATE

Need to explore "what-if" scenarios without rewriting your entire dataset? The CALCULATE function lets you dynamically modify filter context inside measures, giving you the flexibility to test different conditions in real time.
With FILTER arguments, you can override existing filters for specific calculations—like comparing sales with and without a promotion. The function also works seamlessly with ALL() to remove filters entirely, enabling grand totals or custom aggregations. This makes it ideal for creating dynamic KPIs that adapt to user interactions.
Perfect for analysts who need to build interactive dashboards where users can toggle between scenarios—like comparing market performance across regions or time periods—without needing separate data tables. ✨
Ranking Data with RANKX Function
Tired of manually sorting tables to spot top performers? The RANKX function lets you dynamically rank data within visuals—no extra tables or pivot workarounds needed. It’s the secret weapon for sales leaders tracking regional performance or marketers comparing campaign results.
With RANKX, you can rank by any measure (sales, revenue, or custom KPIs) while respecting filter context. The syntax RANKX(ALL(Table), [Measure], , DESC) handles ties automatically, and you can even rank across multiple dimensions. Need to highlight top 5 products? Just add a TOPN() wrapper for instant visual ranking.
Perfect for analysts who need to compare performance hierarchies (e.g., "Top 10 customers by lifetime value") without cluttering the data model. ⚡
Error Handling with IFERROR Function

Real-world data is messy—missing values, division errors, and blank fields can crash your dashboards faster than you can say "refresh." The IFERROR function acts as your safety net, gracefully handling errors before they derail your visuals and calculations.
With just two arguments—your expression and a fallback value—you can replace errors like #DIV/0! or #VALUE! with zeros, blanks, or custom messages. For example, IFERROR([Sales]/[Units], 0) ensures no division errors appear in your KPIs. It’s lightweight, easy to nest, and works seamlessly in measures, calculated columns, and even tooltips.
This is the go-to function for production dashboards where data quality isn’t guaranteed—think finance teams reconciling reports or retail analysts tracking sales with sporadic inventory data. ⚡
Dynamic Segmentation Using SWITCH Function

Tired of rebuilding your dashboard every time stakeholders ask for a different segmentation view? The SWITCH function in DAX is your secret weapon for creating dynamic, interactive reports without touching your data model.
With SWITCH, you can define multiple conditions (like product categories, regions, or time periods) and let users toggle between them using slicers or buttons. For example, a single measure can return revenue by product line when one slicer is selected, then instantly switch to revenue by customer segment when another is chosen—all while keeping the same underlying data. It’s perfect for scenarios where you need zero-config toggling between analysis perspectives.
Business analysts and dashboard creators will love this for its simplicity and flexibility—no need to create duplicate tables or measures. Just drop a slicer on your dashboard and let users explore different views effortlessly. ✨