
PowerPoint

High school students need projects that showcase creativity while demonstrating Microsoft Office mastery. These 10 standout assignments leverage PowerPoint, Excel, and Word to build real-world skills that impress teachers and prepare students for college or careers.
Interactive Science Fair Research Poster

Ditch the boring static poster—your science fair project deserves interactive flair that wows judges and keeps data crisp. This project merges PowerPoint’s design tools with live Excel graphs, letting you embed real-time data visualizations (like bar charts or scatter plots) directly into your poster slides. No more crumpled printouts or messy handwritten annotations!
Start by designing your poster layout in PowerPoint using the "Poster" template (or create a custom one with gridlines for alignment). Then, open your Excel experiment data (e.g., reaction times, pH levels, or growth rates) and copy the relevant table. In PowerPoint, go to Insert > Object > Microsoft Excel Worksheet to embed the data—now you can update the Excel file later, and the poster graphs auto-refresh to show the latest results. Add trendline equations or error bars in Excel before embedding for extra scientific rigor.
Perfect for chemistry, biology, or physics students who want to blend creativity with hard data. Judges will notice how your project marries aesthetics with analytical precision—the kind of detail that earns top scores. ✨
Business Plan for a Student-Led Company

Turn your big ideas into a real business plan—without needing an MBA. This project pairs Word’s professional templates for crisp executive summaries with Excel’s financial modeling to forecast revenue, expenses, and break-even points. Start with a one-page business model canvas in Word (download free templates from Microsoft’s website), then build a three-year profit-and-loss projection in Excel using formulas like =SUM() and =IF() to automate calculations.
Use Excel’s Data Validation to prevent errors in financial entries and conditional formatting to highlight red (losses) or green (profits) at a glance. Link your Word document to the Excel sheet via hyperlinks so teachers can click to see live numbers. For extra polish, add a SWOT analysis chart (Strengths, Weaknesses, Opportunities, Threats) using PowerPoint’s SmartArt to visualize your strategy visually.
Perfect for entrepreneurship classes or students eyeing college business programs. This project proves you can think like a CEO—even if you’re just starting out. 💻
Historical Timeline Presentation with Multimedia

Bring history to life with a PowerPoint timeline that blends visuals, sound, and motion—no boring text walls here. This project turns static dates into an immersive experience by embedding period photographs, short audio clips (like speeches or battle sounds), and embedded YouTube videos (e.g., reenactments or documentaries).
Start by organizing your timeline in PowerPoint’s built-in timeline layout, then enhance each slide with hyperlinks to trigger multimedia. Use audio narration to explain key events, and overlay vintage maps or documents as backgrounds. For extra flair, add animated transitions (like fades or wipes) to mimic old film reels—teachers will love the creativity!
Perfect for history buffs or students researching World War II, the Civil Rights Movement, or ancient civilizations. This project proves you can tell stories that stick long after the presentation ends. ✨
Personal Budget Tracker with Excel Dashboard
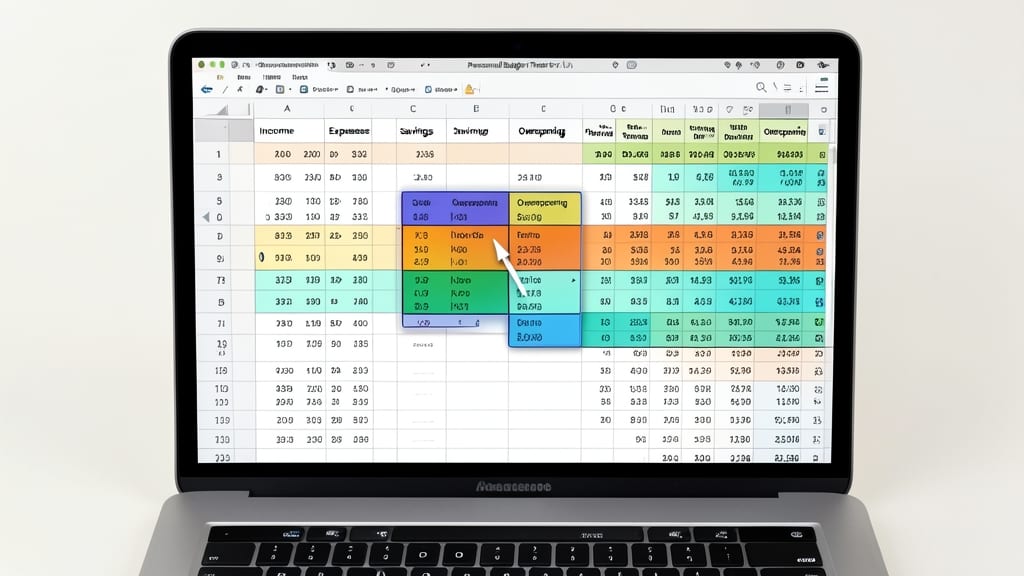
Turn financial lessons into interactive learning with a Personal Budget Tracker in Excel—no coding required. This project transforms abstract money concepts into visual, actionable data by combining pivot tables for dynamic summaries and conditional formatting to highlight overspending in real time.
Start with a monthly income vs. expenses template, then add data validation to prevent errors and sparkline charts to show spending trends at a glance. Use named ranges to simplify complex formulas, and apply cell styles to make categories (like groceries or entertainment) instantly recognizable. The best part? You can link it to real accounts by importing transactions from bank statements.
Perfect for economics classes or life skills electives, this project teaches budgeting while building Excel proficiency. Teachers love how it blends theory with practical, customizable tools students can use for years. ✨
Literary Analysis Infographic in PowerPoint

Tired of reading endless book reports? Transform your literary analysis into a visually stunning infographic using PowerPoint’s smart art tools and custom shapes—no design skills required.
Start by mapping key themes (like symbolism or character arcs) to icons, then use color gradients to highlight mood shifts. Insert embedded quotes as callout boxes and layer character portraits as visual anchors. The Morph transition can even animate thematic connections for dynamic presentations.
Perfect for English students who want to stand out—this project proves you can analyze literature and design like a pro. ✨
School Event Planning Calendar in Outlook
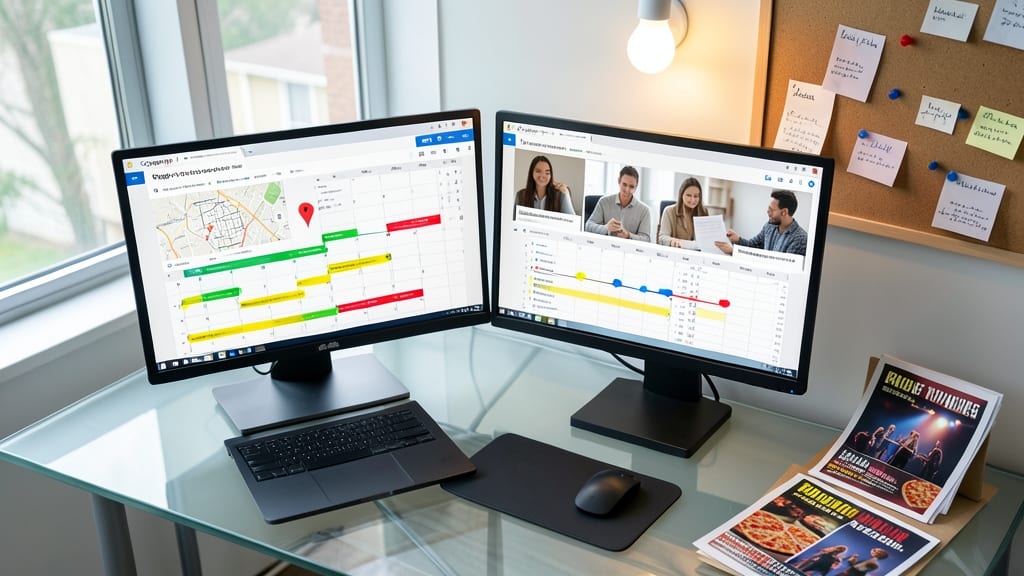
Student council meetings, fundraisers, and club events don’t have to turn into chaotic last-minute scrambles—Outlook’s calendar tools turn planning into a streamlined, collaborative breeze. This project teaches you how to create a shared event hub where every detail—from deadlines to venue attachments—lives in one place, accessible to your whole team.
Start by building a master calendar with color-coded categories (e.g., blue for meetings, green for deadlines, red for urgent tasks). Use the attachments feature to store flyers, permission slips, or budget spreadsheets directly in event entries. Set up recurring reminders for monthly club meetings or weekly check-ins, and share your calendar with teammates via Outlook’s sharing permissions—no more missed deadlines or forgotten supplies.
This project is a game-changer for student leaders who juggle multiple events, proving you can master real-world organization tools while keeping your team on the same page. 💪
Mathematical Modeling Project with Excel

Turn textbook equations into real-world problem-solving with Excel’s Solver tool, a powerhouse for math students who want to stand out. Instead of just solving for x, model scenarios like optimizing a school fundraiser budget, predicting population growth, or designing the most efficient route for a delivery service—all while applying calculus or algebra concepts.
Start by setting up your variables in Excel, then use Solver (Data tab > What-If Analysis) to find optimal solutions. For example, model how changing interest rates affects loan payments or determine the maximum profit for a hypothetical business with constraints. The 3D graphs and sensitivity reports let you visualize how tweaking one variable impacts the entire system—perfect for demonstrating critical thinking to teachers.
This project is ideal for students in pre-calculus, calculus, or advanced math classes who want to showcase analytical skills beyond traditional homework. It’s also a great way to prepare for STEM careers where modeling real-world problems is key. ✨
Digital Yearbook with Hyperlinked Pages
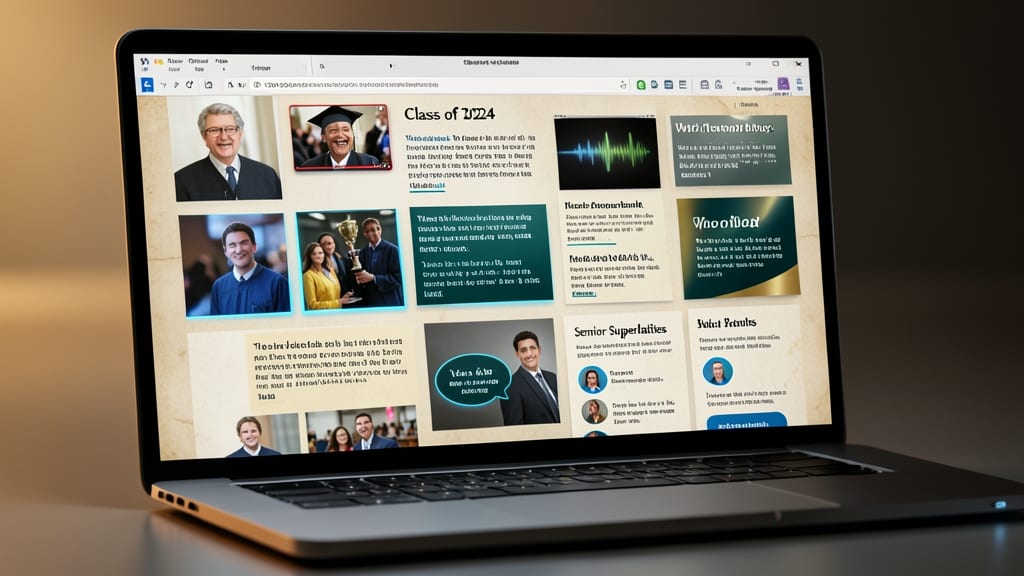
Turn a traditional yearbook into an interactive digital experience by combining Word’s document layout with PowerPoint’s hyperlinking tools. Instead of static pages, students can create a clickable yearbook where photos link to videos, quotes lead to audio clips, and class sections transition with animations—all while learning design fundamentals.
Start by designing pages in Word (for text and images), then export them as PowerPoint slides to add hyperlinks. Use Action Buttons to link between pages or embed YouTube videos of student interviews. For collaboration, store files in OneDrive and assign roles (e.g., one student handles photos, another manages links). The result? A dynamic portfolio that showcases media skills and teamwork.
This project is perfect for media arts classes or group projects where creativity meets tech. Teachers love how it demonstrates multimedia integration and collaborative workflows—skills that stand out on college applications. ✨
Environmental Impact Comparison Report

Turn data into a sustainability debate powerhouse with an Environmental Impact Comparison Report—where Excel’s charts become your most convincing argument. Instead of dry statistics, you’ll create interactive visuals that compare carbon footprints, energy efficiency, or recycling rates across products, cities, or policies.
Start by gathering metrics like water usage (gallons per day) or CO₂ emissions (tons per year) into an Excel table. Use column charts to show side-by-side comparisons and pie charts to highlight percentages. Add conditional formatting to color-code high-impact areas, then export as a PDF or PowerPoint slide for presentations. Pro tip: Use sparkline graphs to embed tiny trends directly in cells.
Perfect for environmental science classes or debate teams tackling climate change topics. This project proves you can make complex data visually compelling—and maybe even change a few minds. ✨
Personal Branding Portfolio in Word

Standing out in college applications or internship interviews starts with a polished, professional portfolio—and Word makes it easier than you think. This project teaches you to craft a resume, cover letter, and portfolio that highlight your skills, all in one document.
Start with Word’s built-in resume templates (like Modern or Classic) to structure your experience, then use headers/footers to add contact info consistently. For your portfolio, insert screenshots of projects (like Excel dashboards or PowerPoint presentations) and hyperlink them to full files stored in OneDrive. The cover letter can be designed with matching fonts and colors using Word’s Quick Styles for a cohesive look.
This is your secret weapon for career readiness—perfect for students in business, tech, or any field where first impressions matter. 🌟