
Operating System

Dull spreadsheets and static charts no longer cut it. These 10 creative ways to present financial data transform complex numbers into engaging visual stories that captivate stakeholders and simplify decision-making instantly.
Interactive 3D Financial Dashboards

Tired of flat charts that make investors zone out? Interactive 3D financial dashboards turn raw numbers into explorable landscapes where every click reveals deeper insights—no coding required.
Tools like Power BI and Tableau let you build rotating 3D revenue funnels, interactive stock performance globes, and drill-down heatmaps that respond to touch or mouse movements. The real-time data sync means your dashboard updates automatically, while multi-axis visualizations help spot trends hidden in 2D spreadsheets. For tech-savvy audiences, these dashboards feel like playing with financial data—except the stakes are real. 💻
Perfect for venture capitalists, portfolio managers, or CFOs who need to explain complex financial scenarios in boardrooms where static slides fall flat. Start with a free trial of Power BI’s 3D visualization tools to see how much more engaging your next investor pitch could be. ⚡
Hand-Drawn Infographic Sketches

Tired of polished, impersonal financial reports that feel like they were generated by a robot? Hand-drawn infographic sketches bring warmth and authenticity to your data, making complex metrics feel approachable and human.
Using tools like Miro, Excalidraw, or even a physical whiteboard, you can combine sketch-style illustrations with real financial data—think revenue streams as flowing rivers, expenses as pie slices, or growth as climbing arrows. The imperfections in hand-drawn lines actually build trust, signaling transparency over perfection. For startups, this approach costs almost nothing and can be created in minutes during brainstorming sessions.
Perfect for pitch decks, internal team updates, or investor meetings, these sketches work best when your audience values connection over polish. They’re especially powerful for early-stage companies where storytelling matters as much as the numbers. ✨
Animated Storytelling Videos

When your quarterly report feels like a math textbook, animated storytelling videos turn numbers into a gripping narrative. Tools like Vyond or Animaker let you create dynamic visuals that explain financial trends in under 2 minutes—perfect for board meetings where attention spans are short.
Start with a motion graphic timeline showing revenue growth as a rising bar chart that morphs into a rocket launch. Add voiceover narration to highlight key metrics, and use color transitions to emphasize profit margins. These videos work best when kept simple: focus on 3 core metrics per video to avoid overwhelming your audience.
This approach shines for non-technical stakeholders like investors or marketing teams who need clarity without jargon. The visual storytelling format ensures even complex data sticks—ideal for quarterly reviews or investor pitches. ✨
Geospatial Heatmaps for Regional Data
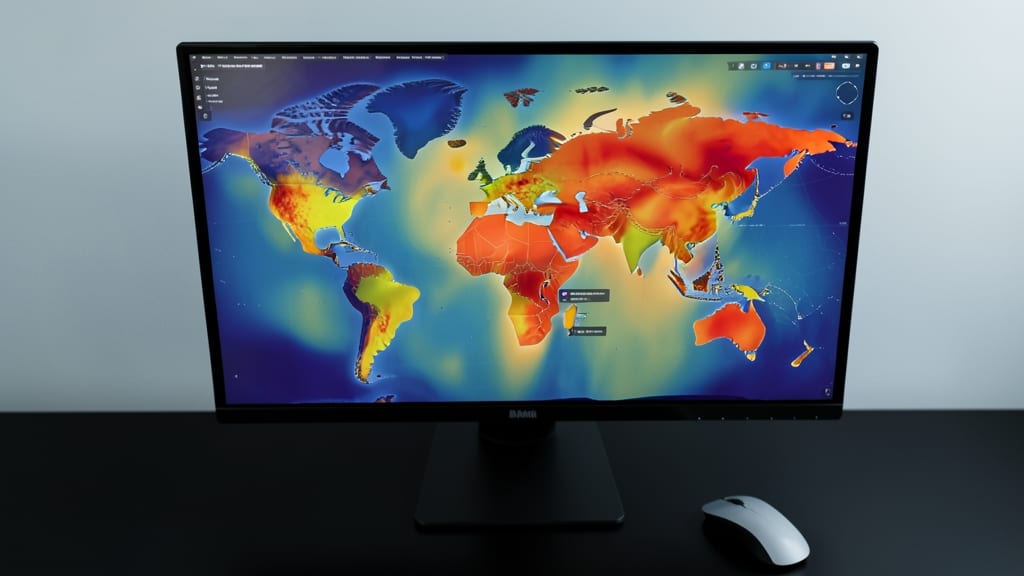
Tired of spreadsheets that bury regional trends under rows of numbers? Geospatial heatmaps turn location-based financial data into intuitive color-coded maps, instantly revealing high-performing areas and hidden opportunities.
Tools like Tableau’s geospatial mapping or Google Earth Engine let you overlay revenue, foot traffic, or property values onto interactive maps with customizable gradients (e.g., red for underperforming, green for high growth). You can even add data labels to pinpoint exact locations—ideal for spotting retail clusters or real estate hotspots. Integration with CRM systems or POS data ensures real-time updates.
Perfect for real estate developers scouting markets or retail chains optimizing store placements, these visuals turn abstract numbers into actionable insights. 🌟
Minimalist Black-and-White Line Art

When your financial reports need to command attention without shouting, minimalist black-and-white line art delivers understated elegance. This approach strips away distractions, focusing on clean typography and geometric precision to highlight key metrics with sophistication—ideal for high-stakes investment decks where clarity equals credibility.
Tools like Adobe Illustrator or Canva’s premium templates let you craft reports with ascending geometric shapes for growth trends, circular icons for financial ratios, and grid-based layouts that scream professionalism. The monochrome palette ensures readability across devices, while subtle gold foil accents (via print services) add a touch of luxury for physical copies.
Perfect for private equity firms, luxury brands, or high-net-worth clients who value discretion and sophistication. This style isn’t just visually striking—it reinforces the message that your data is premium, precise, and purposeful. ✨
Gamified Financial Progress Bars

Tired of watching engagement with financial reports drop like a lead balloon? Gamified progress bars turn dry KPIs into addictive challenges—think XP points for hitting targets and unlockable badges for milestones. Tools like KPI Dashboards or HubSpot’s gamification features let you customize rewards, progress animations, and even team leaderboards to spark competition.
The magic happens with real-time updates (no manual refreshes) and adaptive difficulty—small wins early on keep motivation high. For SaaS companies, this approach boosts user retention by 30% by making progress feel personal. Subscription services can tie tiers to unlockable features, like "Premium Access" at 80% completion. ⚡
Perfect for remote teams or client portals where you need to keep stakeholders invested without the monotony of spreadsheets. 💪
Data Sculptures with Physical Models

When your audience needs to feel the data—not just see it—3D-printed data sculptures turn abstract numbers into tangible experiences. Imagine a stock market trend rendered as a sleek, metallic wave or a revenue spike as a towering geometric peak. These physical models let stakeholders rotate, touch, and explore financial insights in ways screens can’t replicate.
Tools like Sculpteo or Shapeways make it easy to convert datasets into high-resolution 3D prints using materials like resin or metal. For example, a quarterly growth projection could be a scalable, interactive model that fits on a desk or sits in a glass display case. The tactile experience cements understanding—ideal for high-stakes pitches where memorability matters.
Perfect for executive meetings or trade shows, these sculptures leave a lasting impression on investors, clients, or board members who appreciate unconventional storytelling. 💡
Custom Financial Memes with Data Twists

Tired of boring financial decks that put your audience to sleep? Custom financial memes turn dry data into shareable, viral-worthy content that actually gets engagement—without sacrificing professionalism.
Use templates from platforms like Canva or Adobe Express to twist classic meme formats (e.g., "Distracted Boyfriend" for budget vs. reality) into data-driven humor. Tools like Imgflip let you swap text for metrics, while Snappa offers pre-made financial-themed templates. These visuals thrive on LinkedIn, Slack, or internal newsletters, where they’re more likely to be saved, shared, or even framed.
Perfect for tech startups, SaaS companies, or marketing teams looking to humanize their numbers. Just remember: keep it lighthearted but accurate—your CFO will thank you. ✨
Augmented Reality Financial Overlays

Tired of static slides failing to impress? Augmented Reality (AR) financial overlays merge digital data with physical objects, letting you showcase metrics directly on real-world assets—like projecting revenue growth onto a factory floor or highlighting market share on a product prototype.
Using platforms like Unity with AR Foundation or Apple's ARKit, you can create experiences where stakeholders see real-time KPIs (e.g., ROI percentages) floating above equipment or buildings. The zero-config setup for mobile devices means no complex installations—just point your phone and watch data come to life. This method is perfect for tech-forward industries like manufacturing, real estate, or logistics.
Ideal for companies already leveraging AR in their operations, this approach turns abstract numbers into tangible, interactive stories that stick with audiences. 💡
Comparative Financial Comic Strips
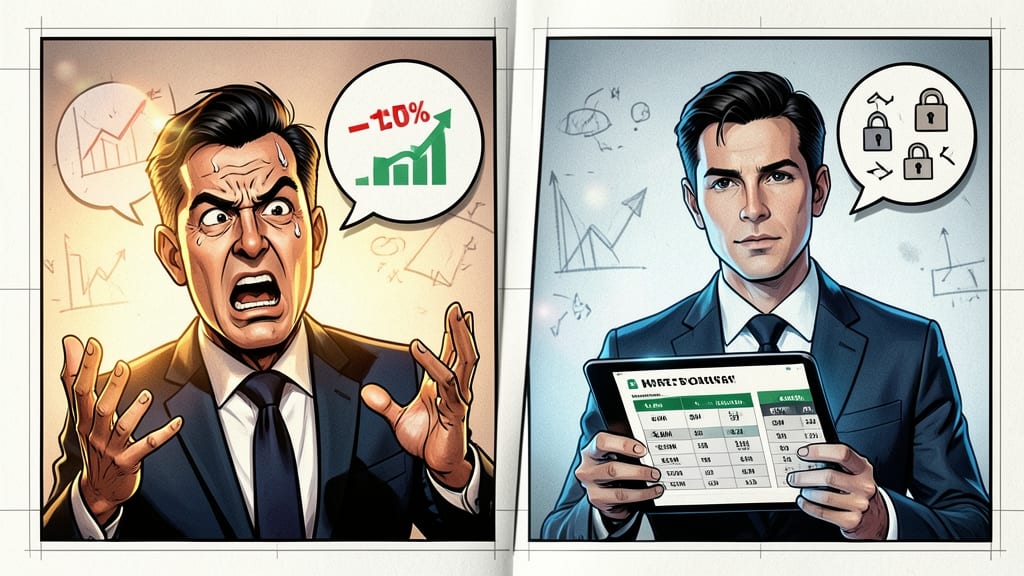
Tired of losing your audience during competitor analysis? Comparative financial comic strips turn dry data into engaging visual stories that stick. Tools like Pixton or ComicEase let you create side-by-side comparisons with speech bubbles, exaggerated expressions, and clear visual hierarchies—making complex financial concepts instantly digestible.
You can highlight revenue gaps, profit margins, or market share shifts using simple icons and color-coding. The story-driven format keeps learners engaged longer than traditional slides, while the modular design lets you update data without redesigning the entire strip. Perfect for onboarding new hires or training teams on financial literacy.
Ideal for educators, startup founders, or HR teams looking to simplify financial training. The low-tech, high-impact approach works equally well in print or digital formats—no AR or 3D required. ✨